BWS Reduce Cart Abandonment
Addressing $13M in annual order loss through usability, testing, and iterative improvements.
Add-to-cart and conversion rates dropped significantly in the BWS funnel, with 85% of order loss occurring on the website—$7.5 million from desktop and $5.7 million from mobile. Cart abandonment was up, with 35% happening during checkout. Payment-related errors were a major contributor, driving 56% of errors on mobile and 48% on desktop.
The Problem
Role: UX/UI Designer, UX Researcher
Year: 2024-2025
Client: BWS
Platform: Website
Collaborators: Product teams, Ecommerce, and CRO
The Process
Stakeholder kickoff & alignment
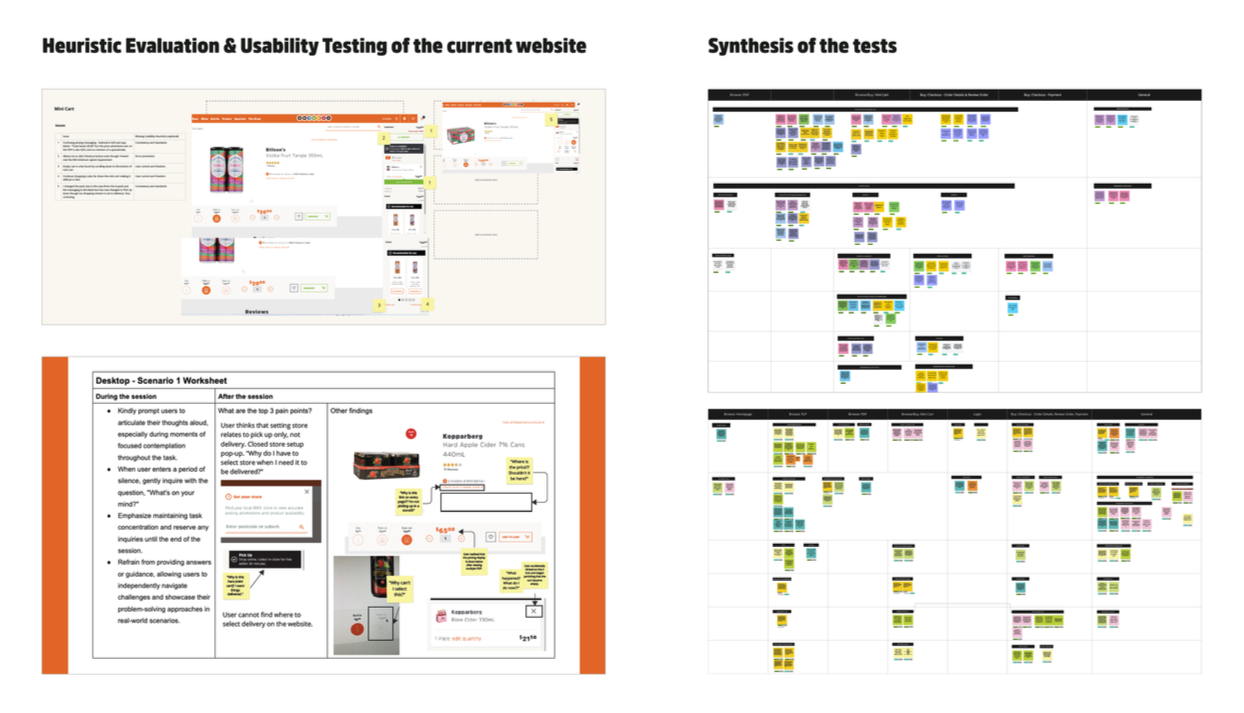
Usability testing of the current website
Heuristic evaluation of existing shopping journey
Competitor and market research
Voice of Customer (VOC) insights analysis
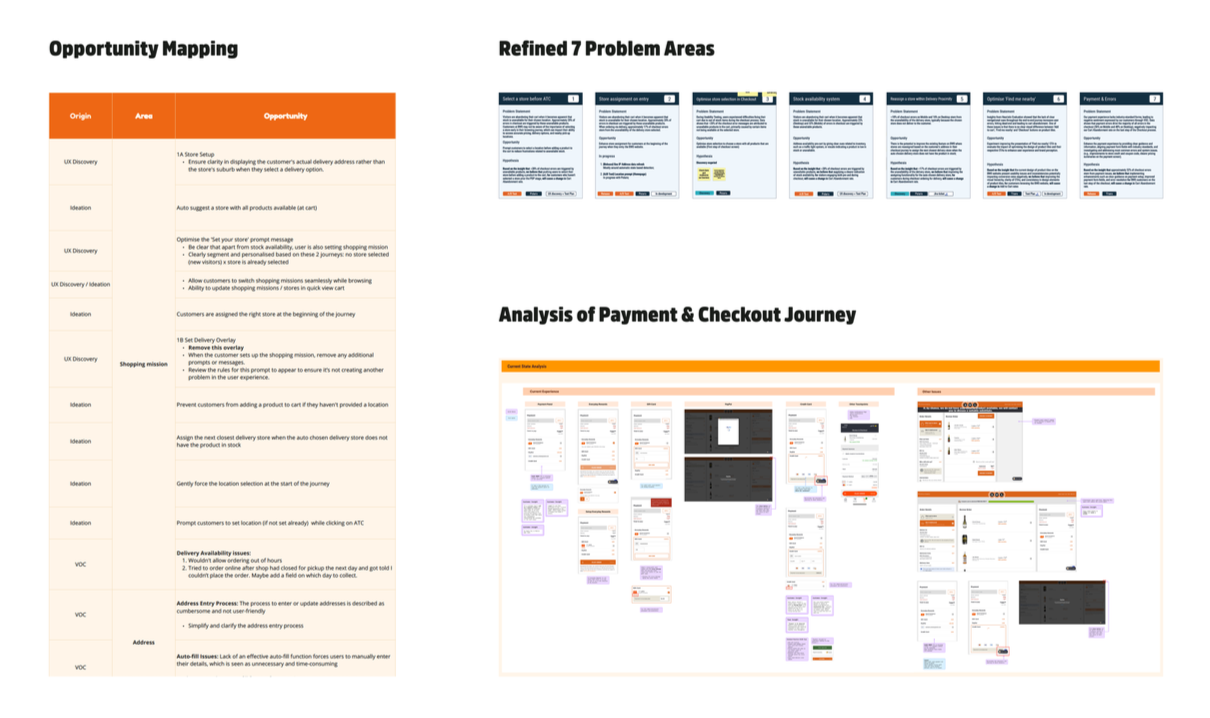
Prioritisation and scoping of opportunities
Ideation and wireframing
Development and delivery
Experimentation through A/B testing
We identified seven problem areas through customer research: shopping mission, out-of-stock items, unclear pricing, form optimisation, payment-related errors, navigation, and accessibility.
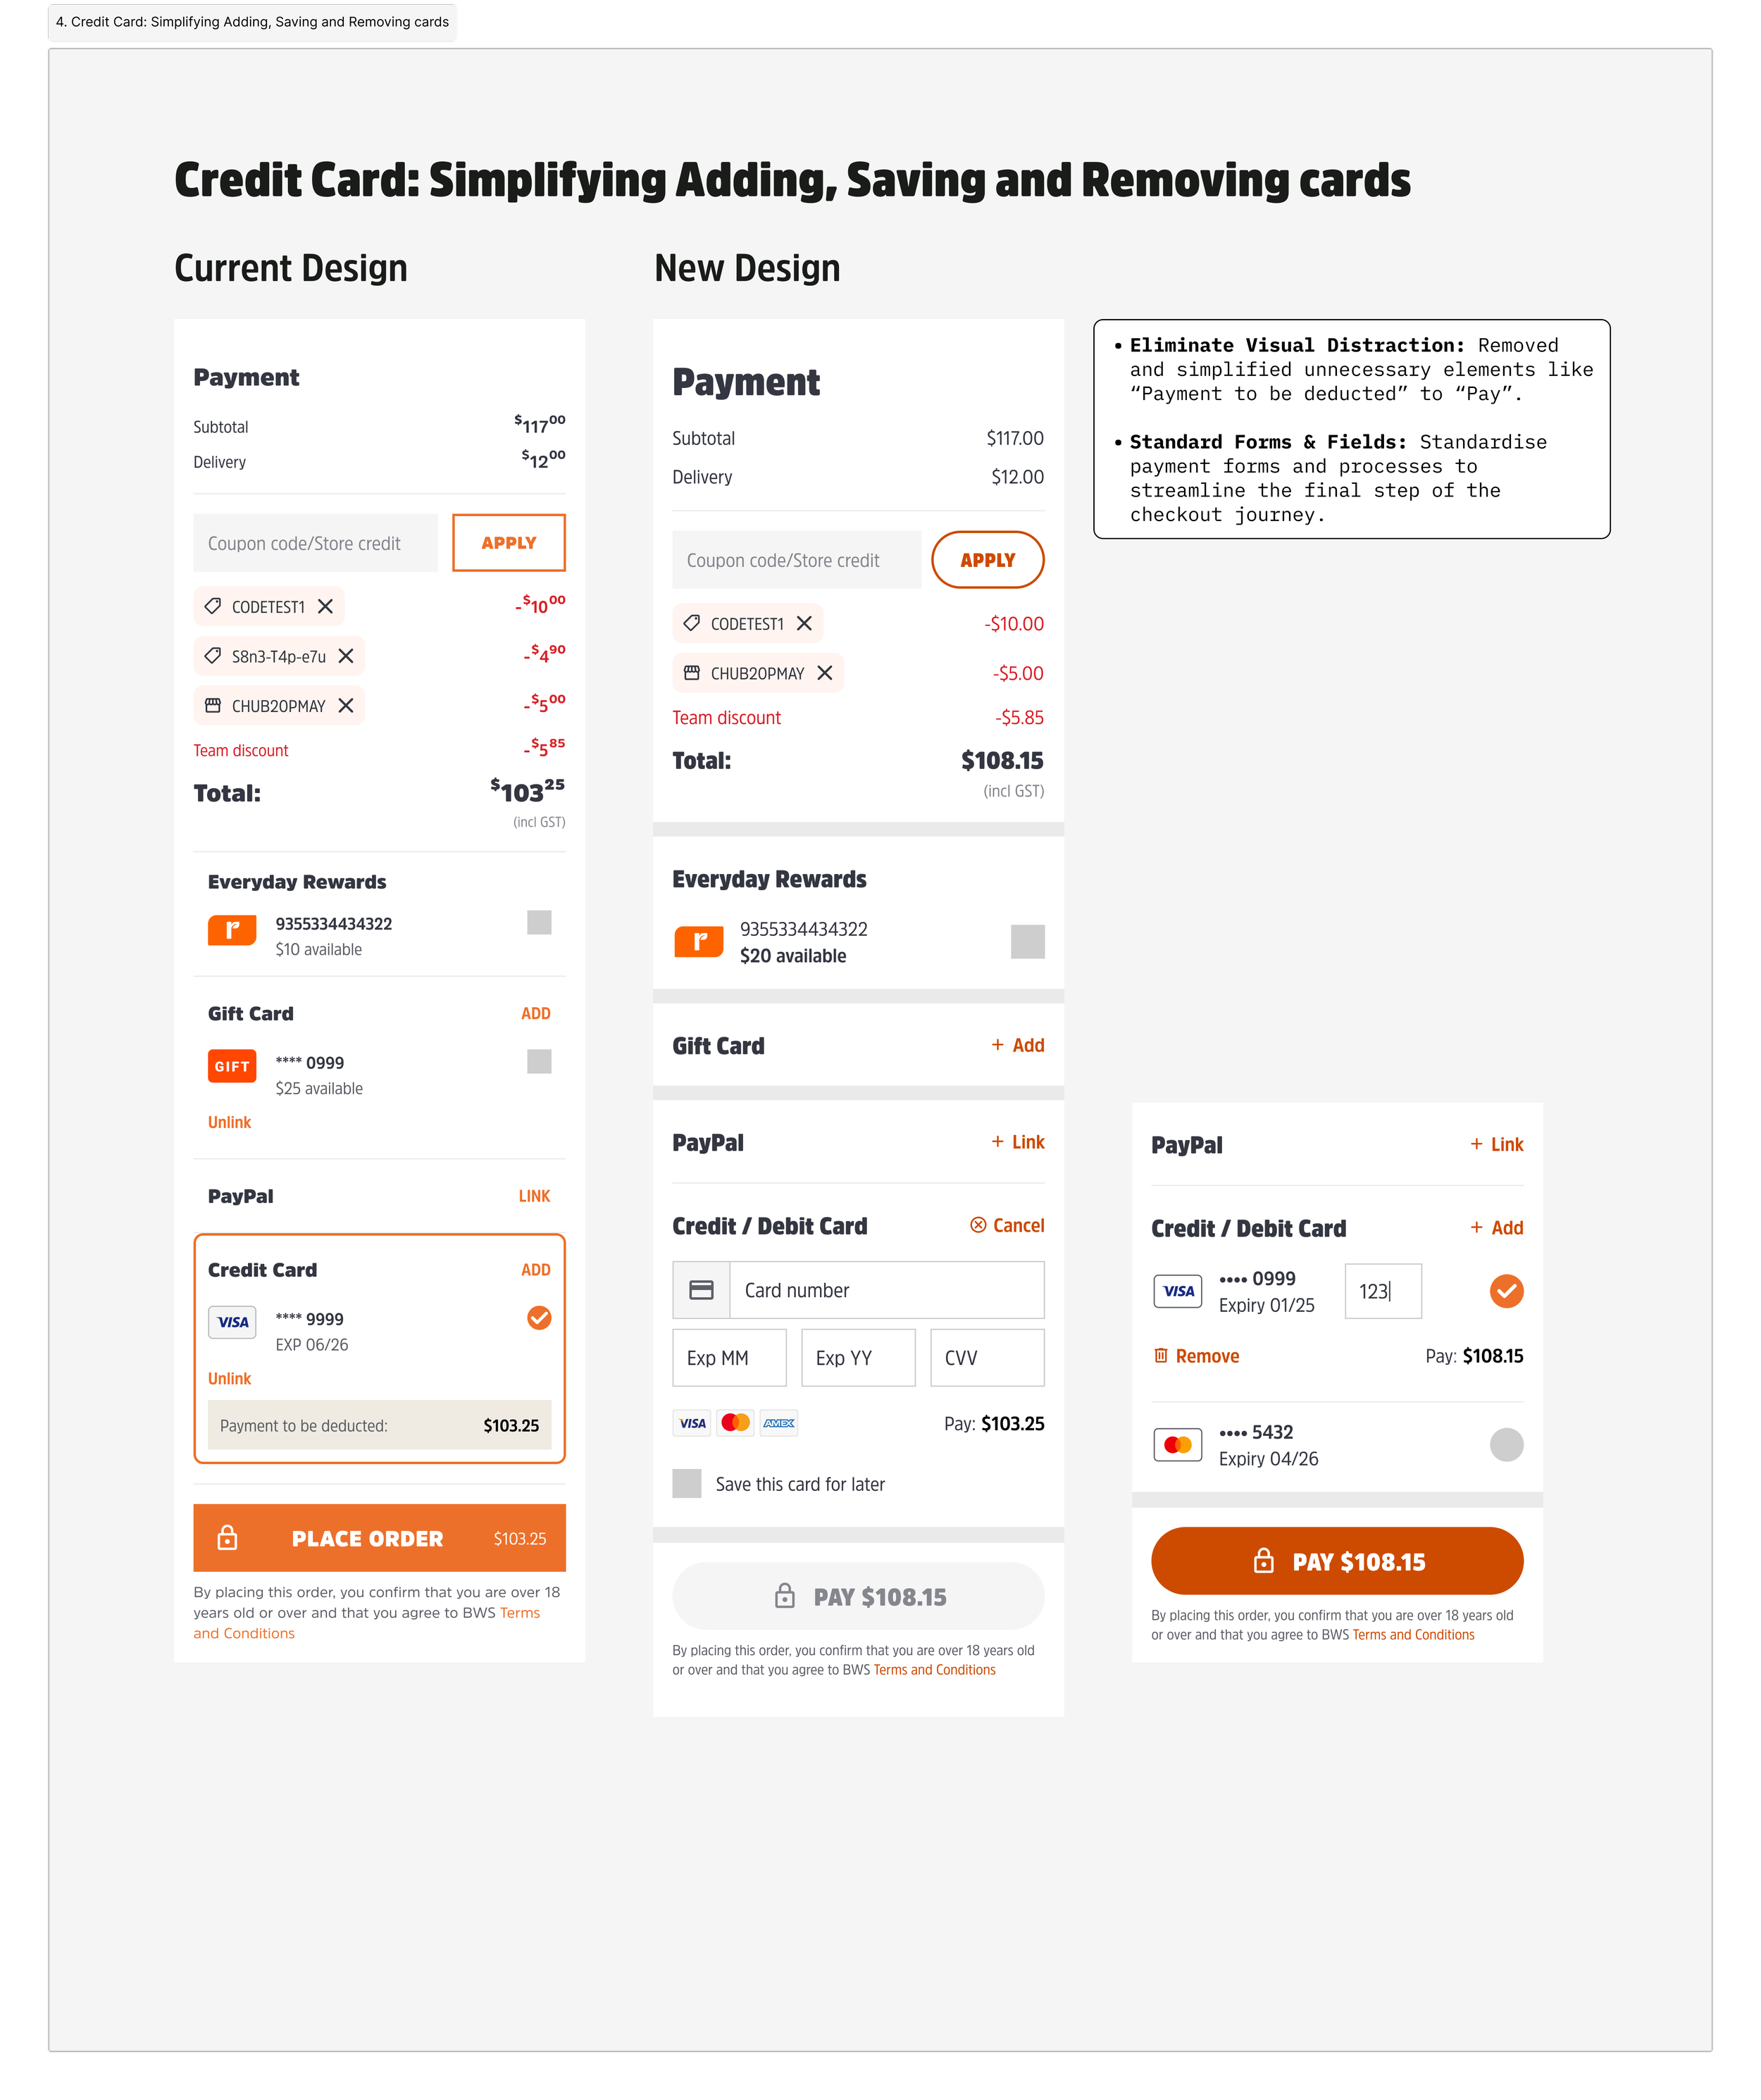
Key Focus Area
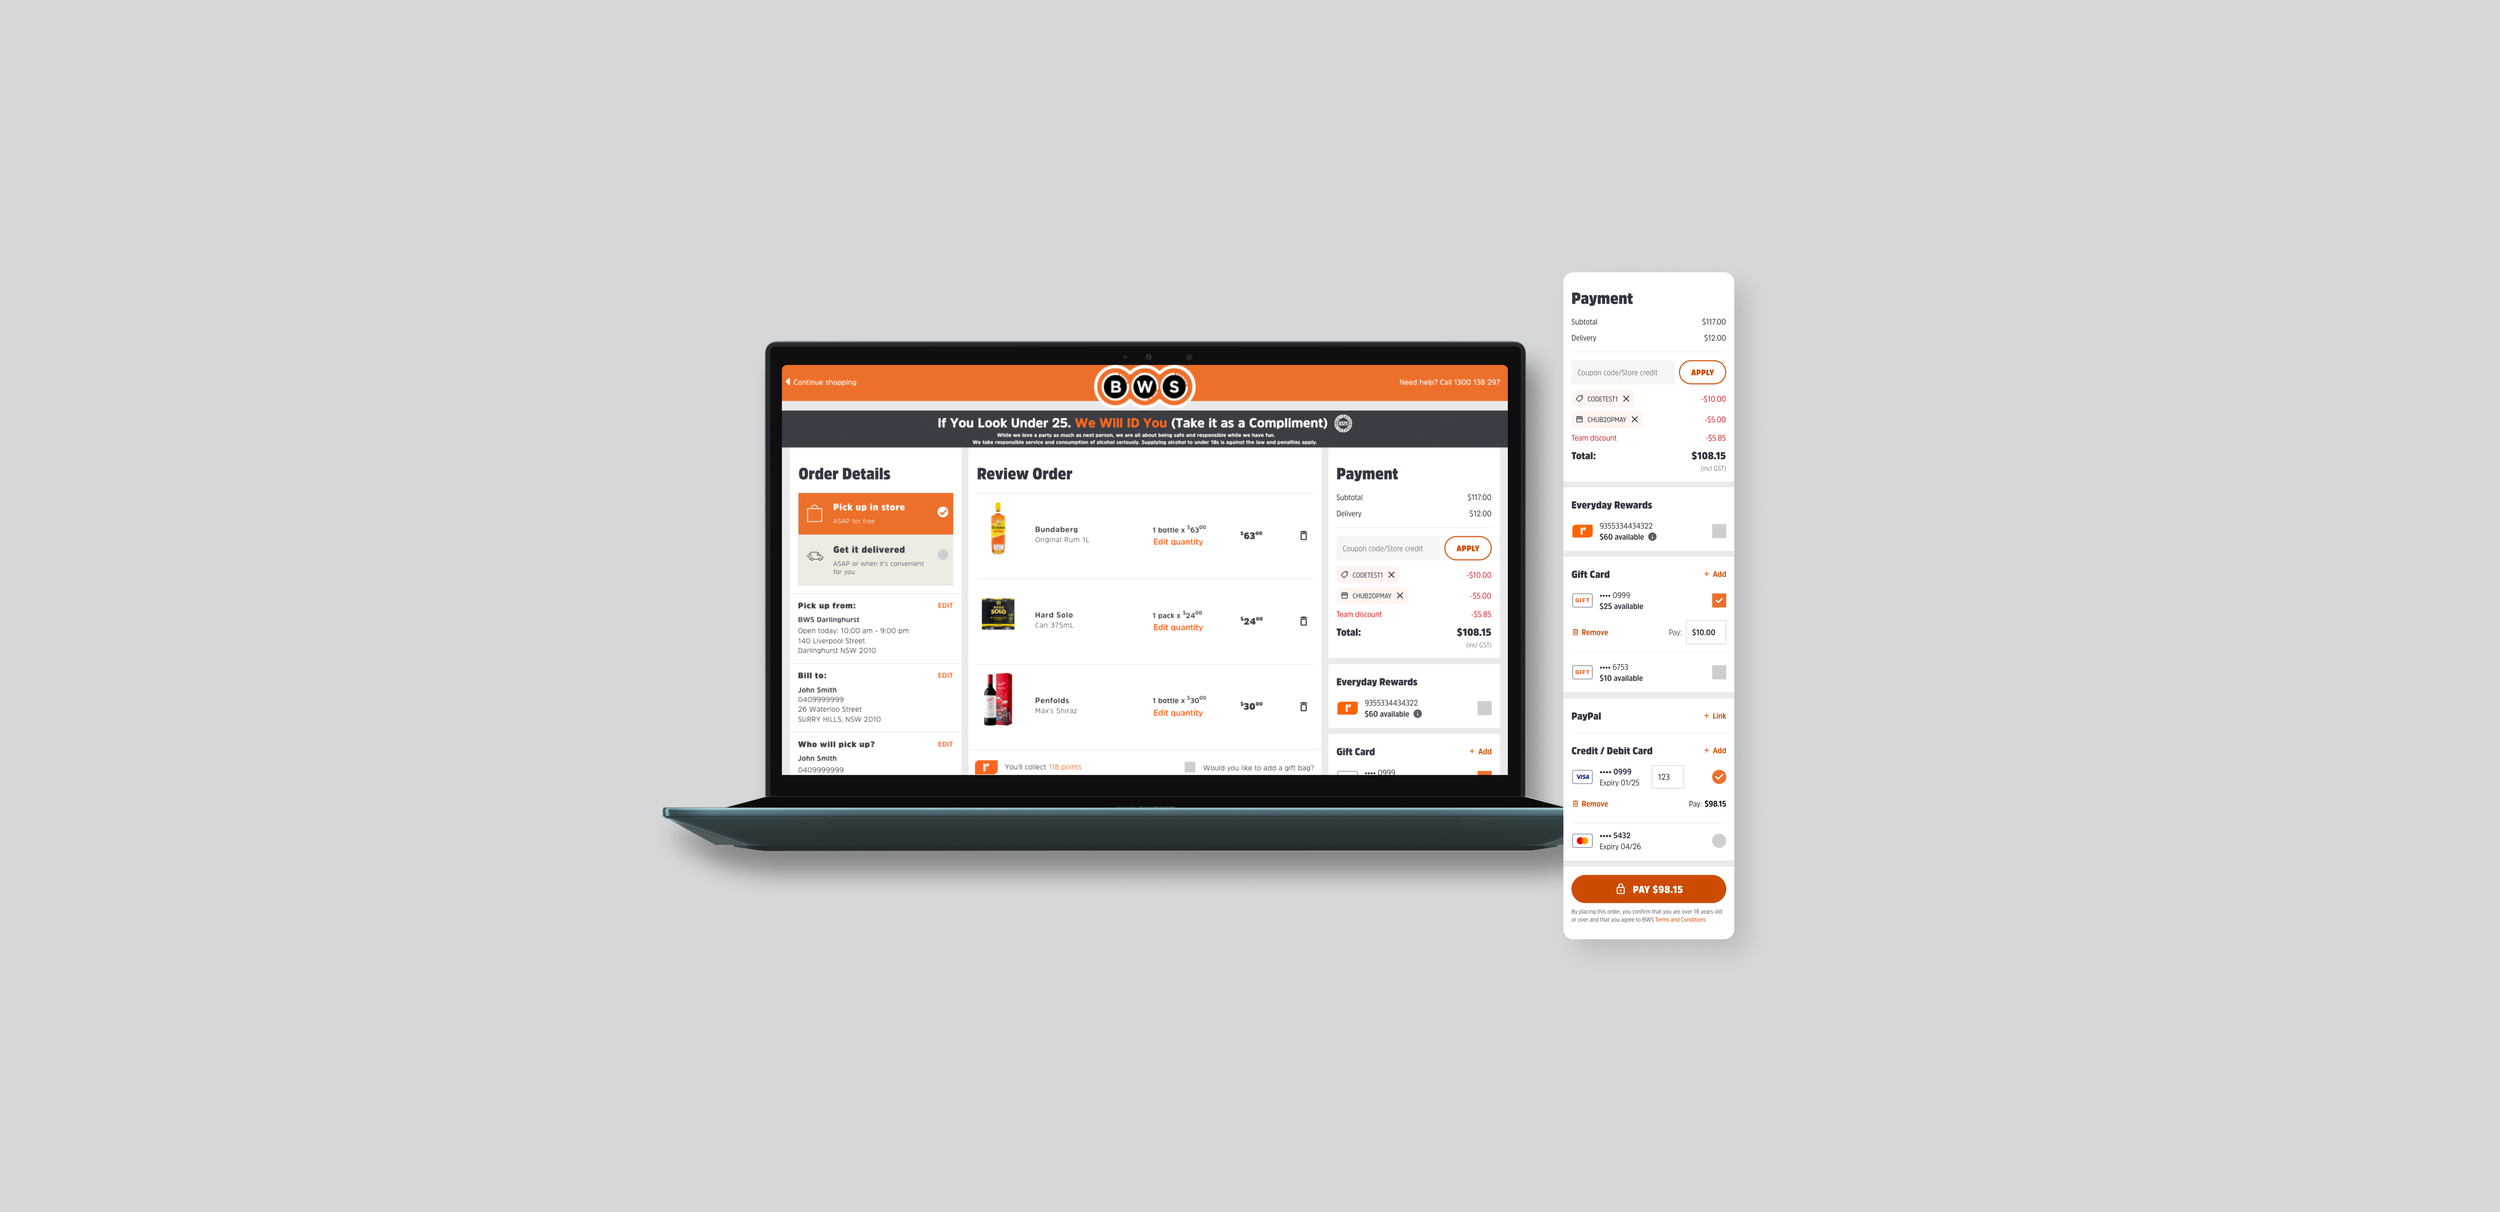
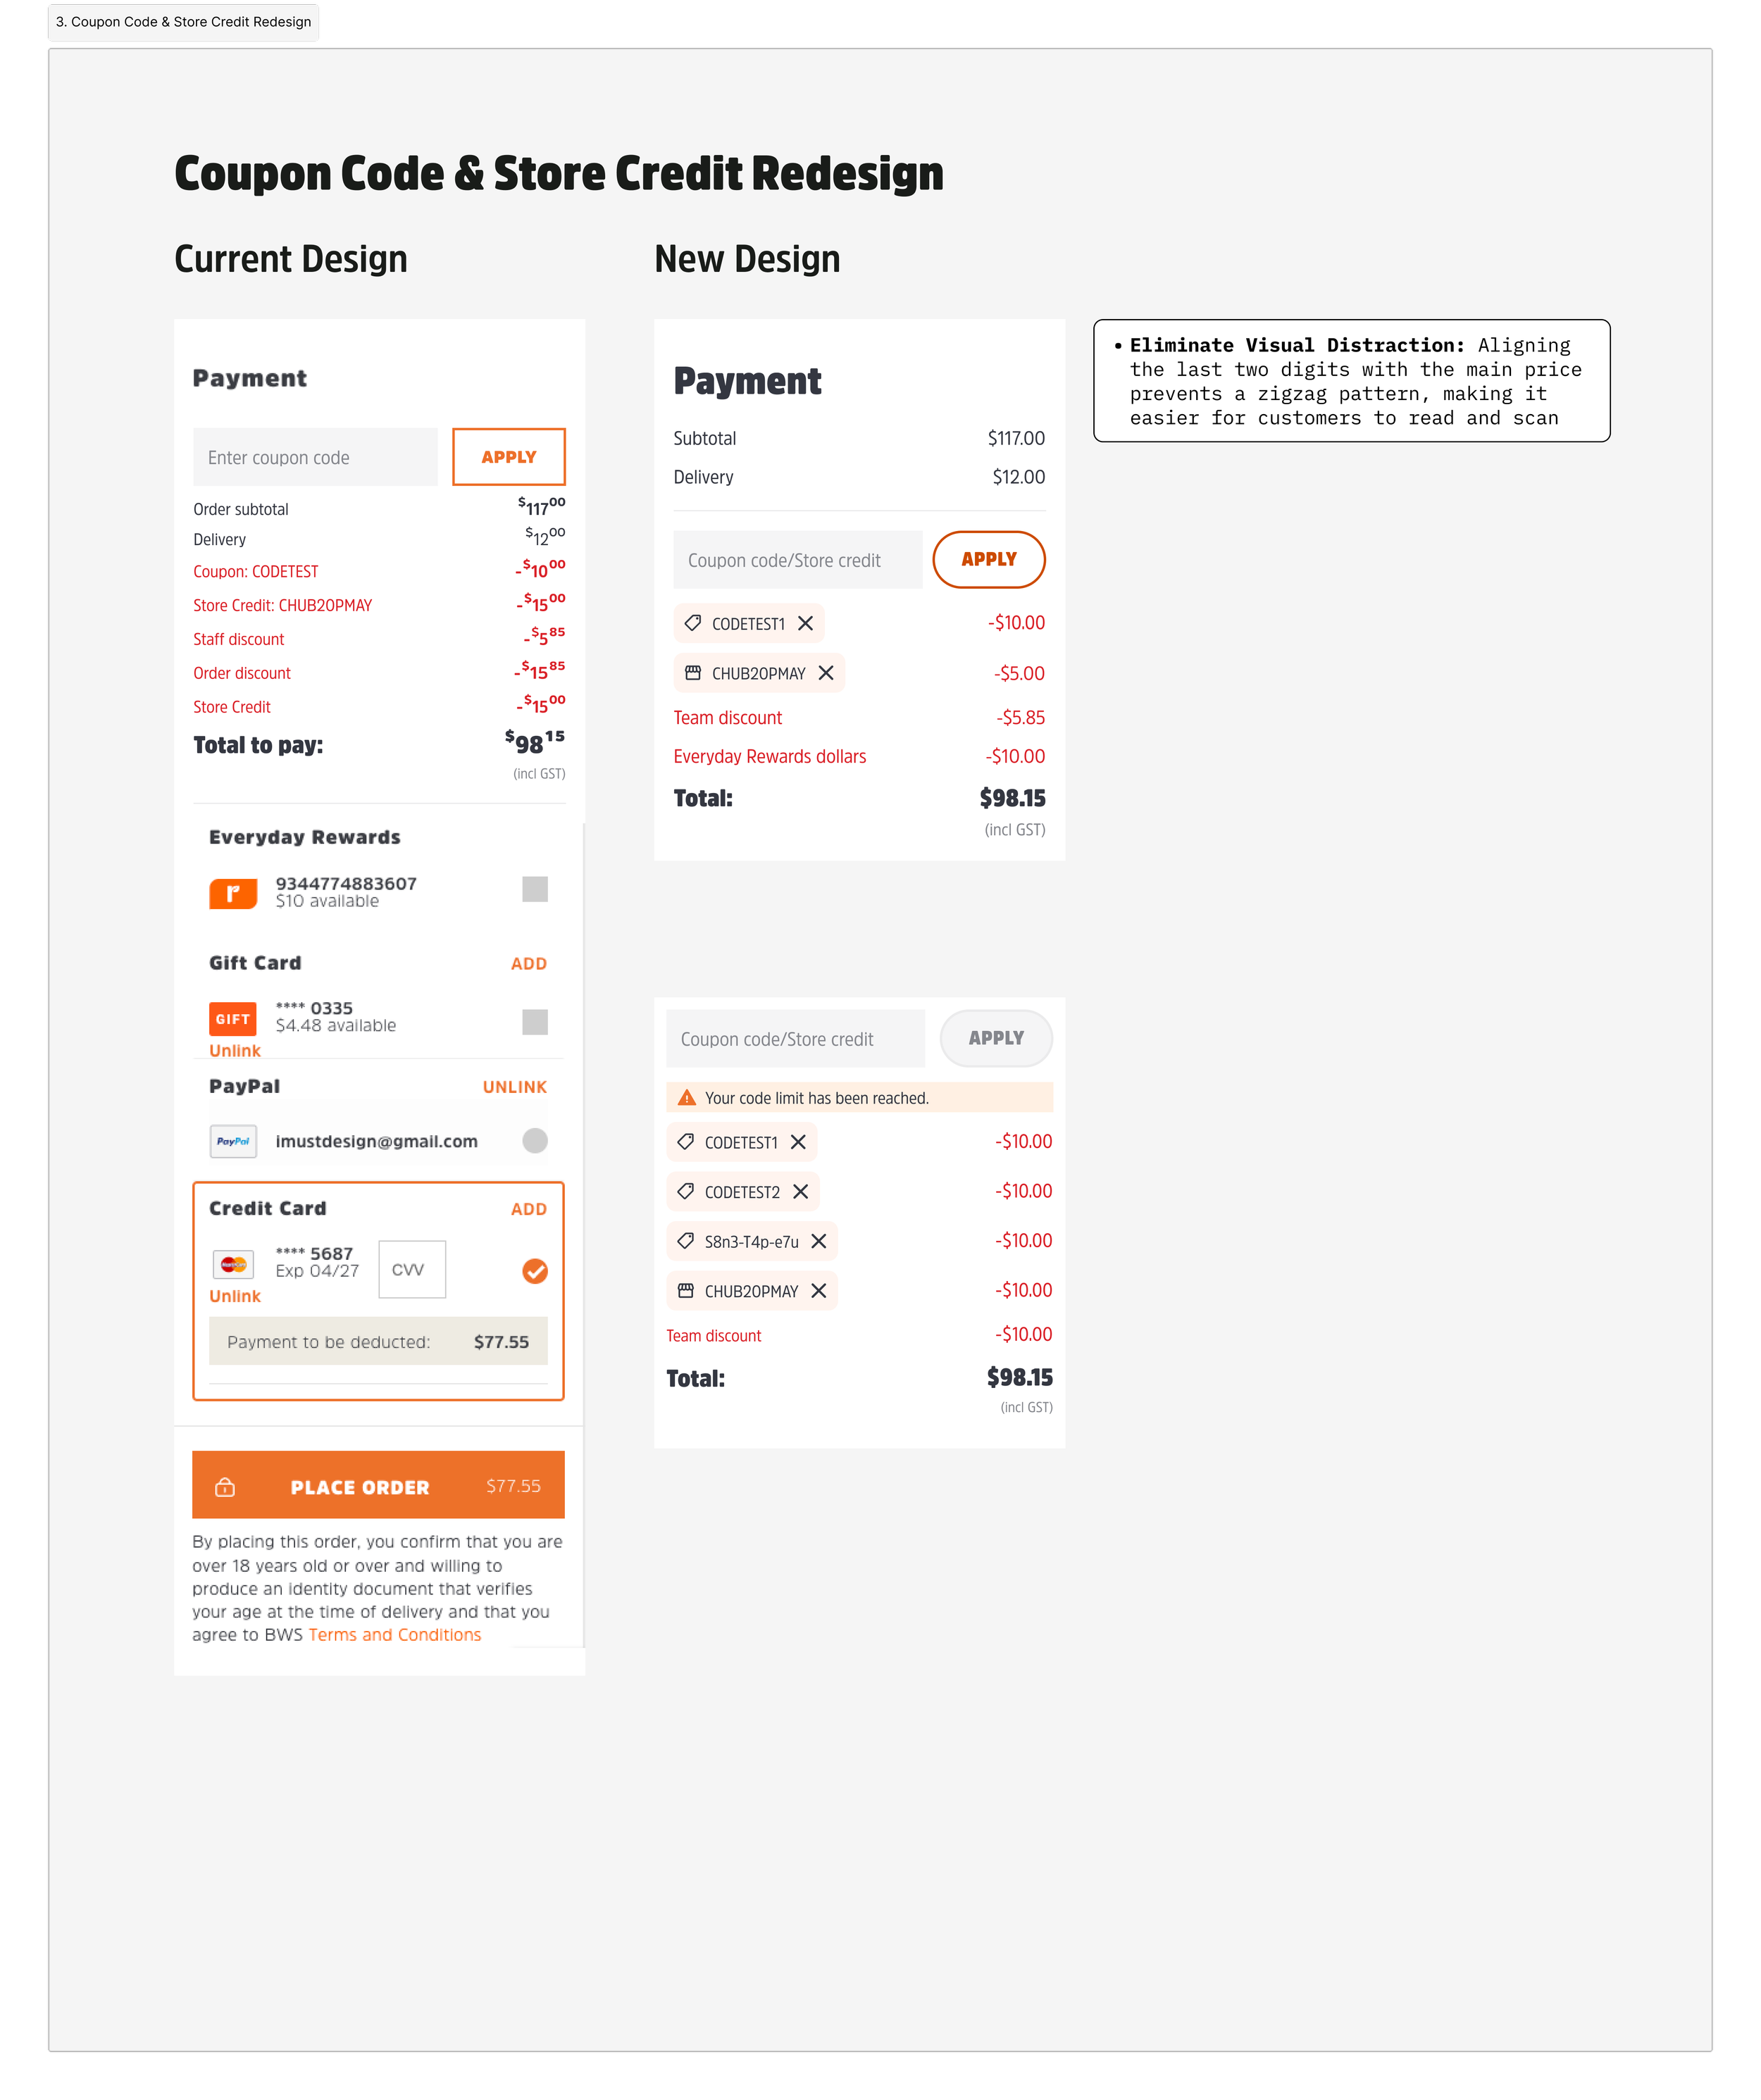
Payment optimisation in Checkout
The payment experience lacked industry-standard patterns and created friction for customers. VOC feedback highlighted frustration with confusing forms and unclear error messages. Data confirmed the issue: payment errors accounted for 56% of all errors on mobile and 48% on desktop, making them the leading cause of abandonment at the last step.
Hypothesis
If we improved payment setup guidance, redesigned form fields, and resolved error handling, we believed this would significantly reduce checkout errors and lower cart abandonment.


The Outcome
The MVP improved the browsing-to-checkout flow, reduced usability friction, and aligned the interface to the latest design system. When I left the project, it was still in the process of being launched, but our prioritisation work projected a strong business impact:
Estimated Cart Recovery Potential:
$1.84M – $1.85M over six months (95% confidence)
Breakdown by Key Areas:
Fixing payment issues: ~$600K
Breakdown by Key Areas:
• Minimum spend errors: ~$247K
• Store reassignment: ~$482K
• Other improvements
(location, substitutes, dead click feedback, address errors): ~$500K
In addition, the new design components created for the payment flow were added to the BWS design system, indirectly contributing to its evolution and ensuring consistency across future projects.
These projections shaped our roadmap, helping the team prioritise the highest-impact fixes first while setting up for future optimisation.

More Projects

Dan Murphy’s Signature Service
Taste Profile

CoffeeNut